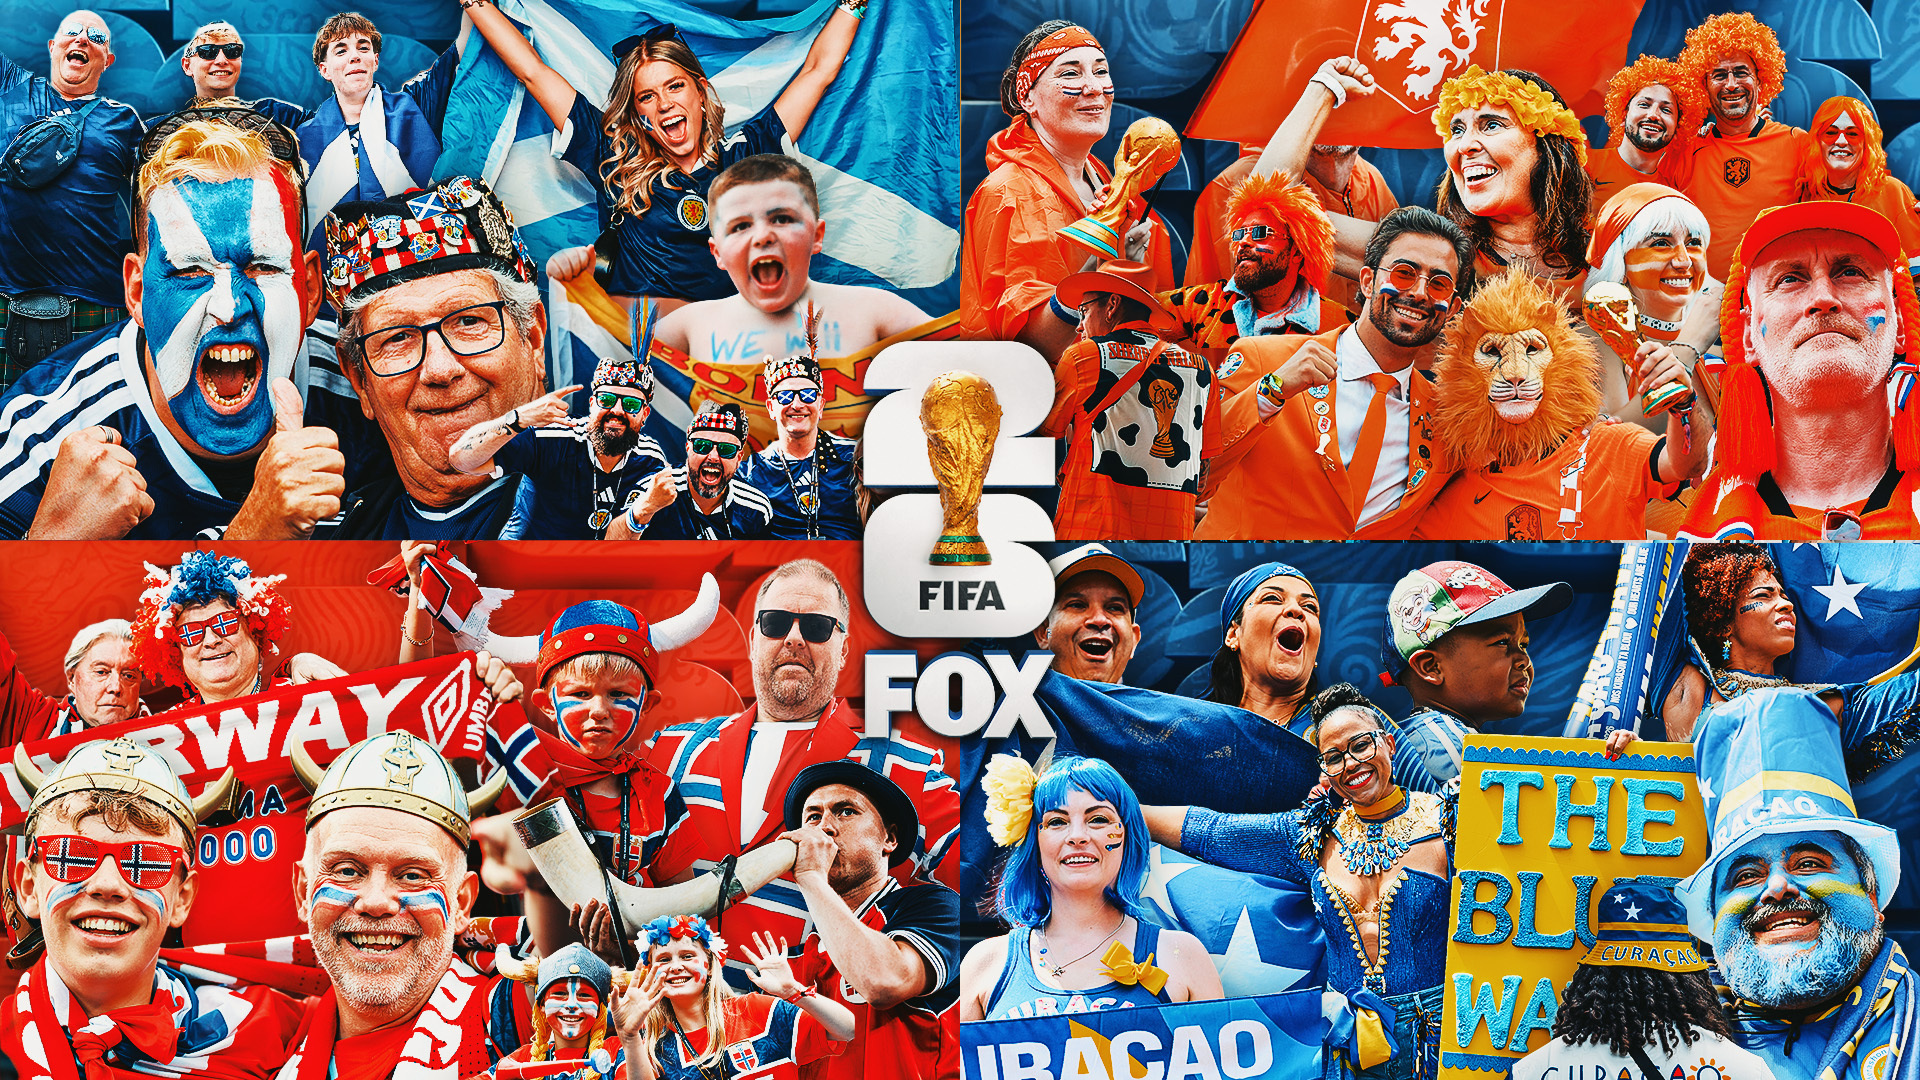
Categories
Uncategorized

The World Cup and human trafficking: What the research reveals about the real risks at major sporting events

Houston rolls out a human trafficking awareness campaign ahead of the 2026 FIFA World Cup. Ropnaldo Schemidt/AFP via Getty Images

As U.S. cities prepare to host the FIFA World Cup, familiar warnings about human trafficking “spikes” at major sporting events have reemerged.

Media outlets point to elevated risks, advocacy groups roll out awareness campaigns, and city authorities and law enforcement ramp up anti-trafficking efforts.

This is all well intentioned. But as experts in human trafficking and the commercial sexual exploitation of children, we believe the talk of an increased risk might be misplaced. Two decades of empirical research across events such as the Super Bowl, Olympic Games and prior World Cups show no consistent evidence that human trafficking increases because of large sporting events. Further, framing trafficking as episodic and event-based can be counterproductive.

The ‘flashlight effect’

The belief that major sporting events produce spikes in human trafficking has circulated for more than two decades, gaining international prominence around the 2004 Olympic Games and reappearing consistently during subsequent FIFA World Cup tournaments, Olympic Games and Super Bowls.

The narrative persists largely because it appears intuitively plausible: Large influxes of tourists, temporary workers, nightlife activity and commercial spending are assumed to increase demand for commercial sex generally and also exploitative labor.

While these events do temporarily increase tourism and commercial sex markets, trafficking itself is not event-driven.

Studies examining arrest records, hotline calls and social service engagement during major events find fluctuations consistent with increased visibility and reporting, but not necessarily increased victimization.

Research shows that while some major sporting events correspond with increases in online commercial sex advertisements, those increases are not unique to the event and are comparable to other large conventions, holiday weekends or tourism-driven gatherings. For example, a National Institute of Justice-supported study analyzing escort advertisements during large public events concluded that Super Bowls “did not stand out” relative to other events in terms of changes in the commercial sex market.

Similarly, anti-trafficking organizations within the United States such at the Polaris Project and Anti-Trafficking Review
have noted that increases in calls to the National Human Trafficking Hotline during major sporting events likely reflect intensified publicity campaigns and greater hotline visibility rather than confirmed increases in trafficking itself.

Scholars have described this phenomenon as a “flashlight effect,” in which increased media attention, specialized law enforcement operations and public awareness efforts generate more reports, arrests and detections because more people are actively looking for trafficking indicators – not necessarily because more exploitation is occurring.

In other words, heightened awareness campaigns may produce detection effects rather than there actually being more incidents. Conflating the two leads to misinterpretation of trends and misallocation of resources.

The human trafficking myths

The narrative that people face an increased risk of becoming the victims of trafficking at big sporting events is based on a number of myths and misconceptions. One is that traffickers will travel to host cities to abduct or exploit unknown victims.

In reality, most trafficking – both sex and labor – involves recruitment through existing relationships: intimate partners, family members, acquaintances or trusted community ties. Grooming, coercion and economic dependence unfold over time, often long before any event occurs. Event-focused enforcement strategies therefore risk targeting the wrong mechanisms of exploitation while neglecting root problems.

Another common myth is that trafficking tied to these events primarily involves the sex trafficking of women and girls by organized criminal networks. This framing obscures the prevalence of labor trafficking and the diverse nature of victims. Evidence from several national datasets shows that labor trafficking occurs across industries likely to scale up during major events such as hospitality, construction, food service and cleaning services.

However, labor trafficking often gets overlooked. Moreover, victims can include men, boys, LGBTQ+ people and U.S. citizens – many of whom do not fit the sensationalized narrative that dominates event-related discourse.

These myths are not benign. Rather, they have measurable consequences. First, they distort policy by shifting resources toward short-term, high-visibility enforcement – through law enforcement stings, raids and temporary task forces. This comes at the expense of more sustained investment in trauma-informed care and programs that address root causes, such as housing stability.

Second, they contribute to victim misidentification. Individuals who do not resemble the “typical victim” portrayed in media – such as those with convicted of violent crime, substance use or complex trauma histories – may be overlooked or even criminalized.

In addition, these myth-driven campaigns can inadvertently increase surveillance and policing of marginalized communities, including immigrants, sex workers and unhoused individuals, without improving safety or access to services.

Limiting the field

While it could be argued that any increased attention to human trafficking is welcomed, there is a downside: Treating the problem as episodic and event-based can obscure the developmental and cumulative nature of trafficking.

Trafficking is closely linked to adverse childhood experiences, poly-victimization – that is, being exposed to multiple different forms of victimization across one’s lifespan – and structural inequities.

Focusing on high-profile events like the World Cup limits the ability of communities fighting human trafficking to build longitudinal, prevention-oriented strategies that intervene early and across child welfare, education, healthcare and housing systems.

To bolster prevention, we believe public attention and resources must move from panic to precision. That means aligning interventions with evidence. It also means investing in cross-sector identification and referral systems, expanding labor trafficking detection, supporting survivor-led services and addressing the structural conditions that create vulnerability at all times – not just every four years.

The Conversation

Kathleen Murray Preble has received funding in the past and/or currently from the Missouri Foundation for Health (MFFH), the Missouri Collaborative Against Human Trafficking (MCAHT), and DOJ Bureau of Justice Assistance. The opinions expressed in this article represent those of the author and do not reflect the views of the DOJ, MFFH, the MCAHT, UTA, or the University of Texas System.

Jennifer E. O’Brien has received funding from the Centers for Disease Control, National Institutes of Health, and the National Institute of Justice. She is affiliated with The University of Texas at Arlington School of Social Work.

The opinions expressed in this article represent those of the author and do not reflect the views of The CDC, NIH, NIJ, The University of Texas at Arlington, or the University of Texas System.

​Politics + Society – The Conversation

Categories
Uncategorized

Getting disability benefits got harder after the Social Security Administration’s staff was slashed and program rules were changed by Trump

The agency has cut more than 13% of its workforce. AP Photo/Nam Y. Huh

A rapid series of administrative, staffing and policy changes the Social Security Administration underwent early on in the second Trump administration are making it much harder to get disability benefits that millions of Americans rely on to make ends meet.

The agency cut more than 7,100 jobs – more than 13% of its workforce and its largest staffing cut ever. It closed six of its 10 regional offices, moved more services online and expanded the use of automated and artificial intelligence systems on its public phone lines.

Some rules changed and changed back again. For instance, Social Security officials announced in March 2025 that people would no longer be able to apply for benefits on the phone, only to reverse course a month later.

We’re social work professors at California State University, Sacramento, Binghamton University in New York and the University of Wisconsin-Madison who study these programs. And we have each independently found that even before 2025, it was hard to get disability benefits.

Now, we’ve found that the process has become even harder.

Missing metrics

In June 2025, the agency removed key customer service metrics, such as phone wait times and disability claim processing times, from its website. This data had provided the public with critical transparency about the agency’s performance.

Lacking insight into the impacts of the many changes underway, we launched a project to study how they were affecting access to disability benefits. We interviewed benefits representatives – lawyers, social workers and other kinds of advocates who help applicants and beneficiaries navigate Social Security systems.

We conducted in-depth interviews with 52 advocates at 32 nonprofits, such as legal aid agencies and disability organizations. These organizations collectively assist over 8,000 people every year.

We’re referring to these advocates by pseudonyms to maintain their privacy. Many insisted that neither they nor their employers be identified due to fear of retaliation by the Trump administration.

We published our findings in collaboration with two national disability advocacy organizations, the Disability Rights Education and Defense Fund and the American Association of People with Disabilities, in March 2026. We took the step of publishing with these organizations before submitting our work to academic journals because we wanted to share these findings with the public as soon as possible.

16 million people get these benefits

The Social Security Administration is a federal agency that runs some of the country’s biggest social safety net programs, including benefits for more than 60 million retired workers, as well as survivor benefits for the spouses of workers who have died and their children who are under 18.

In addition, the agency administers two kinds of disability benefits to a total of 16 million people.

Supplemental Security Income, or SSI, is a public assistance program for low-income older adults and people with disabilities under age 65. In 2026, it provides a maximum of US$994 per month for any one person getting benefits.

Social Security Disability Insurance, or SSDI, provides a limited pension for those who have worked long enough to qualify and now have disabilities that prevent them from working any longer. Payments vary based on one’s past wages, but the monthly average in 2026 is about $1,634.

To receive either kind of benefits, Americans must meet the Social Security Administration’s strict definition of disability, which considers health status, past education and employment and age to determine if a physical or mental disability makes someone unable to work.

There are no time limits on how long you can receive SSI benefits. But children and adults under age 65 are subject to periodic assessments of their eligibility and must adhere to the program’s rigid rules. For example, they can’t have more than $2,000 in assets at any time while receiving benefits, must submit their pay stubs for any earned income monthly, and must report any changes in their living situation, marital status or bank accounts.

People engage at a meeting, where many of them appear to be over 65.
Ray Render, left, a staffer for Rep. John Rose, meets with constituents in Gallatin, Tenn., about their concerns related to changes to Social Security Administration practices in March 2025.
AP Photo/George Walker IV

Encountering long wait times and chatbots

The Trump administration made no formal changes to eligibility criteria for SSI or SSDI, despite considering proposals that could have narrowed eligibility rules and potentially excluded millions who qualify for these benefits today or reduced the size of benefits payments for many people with disabilities.

But when the Urban Institute, a nonpartisan research center, analyzed state-level data from the first half of 2025, it found that 7% fewer claims for disability benefits were submitted to the Social Security Administration than during the same period a year earlier.

We got more insight into these changes during our interviews.

We heard that with fewer employees, the agency had fewer people available to answer phone calls, contributing to long waits. Customer service protocols also changed so that phone calls to the Social Security Administration were routed to field offices the callers hadn’t dialed, where staff couldn’t help them.

Other benefits representatives encountered AI chatbots that did not answer their questions, or found that staffers with specialized knowledge had been reassigned to perform other tasks.

“I just have so many cases that are stuck in purgatory because they don’t have enough workers to work them,” said Jane, a paralegal we interviewed in Social Security’s Kansas City region. “They don’t have enough workers to answer the phone to tell me what’s happening to them.”

Field office frustrations

Another source of friction emerged around visits to Social Security Administration field offices.

The agency has more than 1,200 field offices across the nation where people can seek services. Shortly before Trump took office in 2025, the agency began moving from walk-in services to requiring appointments. But the Social Security Administration had promised in 2024 that it would “not turn people away” if they couldn’t or didn’t want to make an appointment.

And yet benefits representatives told us in 2025 that many field offices did require appointments, and turned people away if they arrived without them.

This was especially frustrating because it was hard to make those appointments over the phone anymore, said Freddie, a benefits representative in the Denver region. “Now, we can’t reach anybody at Social Security,” she told us. “We can’t get through to make an appointment.”

As of May 2026, 10 offices in nine states are either open on an appointment-only basis or closed to the public until further notice.

Obstacles online and in person

The Social Security Administration’s push to conduct business online assumed that everyone could easily use digital platforms. But that’s simply not true for many of the most vulnerable low-income people with disabilities who have or are applying for SSI and SSDI benefits.

As Michael, an attorney in the Atlanta region, explained, it’s not reasonable to assume that “someone who’s in their 20s, but unhoused” or “someone in their 70s and having issues with memory loss” can handle an online application process.

Another challenge is the Trump administration’s crackdown on immigration, which has now extended to people who are authorized to live in the United States. Many immigrants who get disability benefits, or who support their relatives with SSI and SSDI benefits, are no longer sure it’s safe for them to visit Social Security offices.

Those fears were reinforced in February 2026, as reports emerged that some Social Security workers had been told to share appointment data with Immigration and Customs Enforcement agents.

Several benefits specialists told us they no longer know how to advise such clients about the potential risks of interacting with the Social Security Administration, including whether it was safe to visit field offices or whether the agency might share their information with immigration authorities.

Dying while waiting

Staff cuts meant that the problem-solvers who advocates had once turned to had left, taking years of expertise with them. The agency’s remaining staff members were harder to reach than ever. Some were less familiar with the intricacies of the Social Security Administration’s policies and procedures than their senior colleagues who had left.

As disability benefits have become harder to obtain, many people are suffering. We heard multiple accounts of terminally ill clients dying before receiving benefits for which they were eligible.

For example, Anne, an attorney in the agency’s Philadelphia region, described the case of a homeless, seriously ill client who couldn’t move forward because Social Security Administration staff told her that they couldn’t locate paperwork she had submitted three years earlier.

“This woman is dying,” Anne said. “All you have to do is push a little button to get this moving, and you’re telling me you can’t.”

Miranda, an attorney in the Philadelphia region, explained that in the past, she advocated for clients over complex legal issues. During the second Trump administration, that’s changed.

Now, her clients may find that they need an attorney simply “to make sure something gets off someone’s desk and then faxed into the system.”

Faxing, rarely necessary for most everyday business transactions, is commonly used during the disability benefits application process.

“It is taking more of my time to do the same amount of work, which then means we’re not able to take as many cases” said Megan, a paralegal in the Boston region.

Suggesting possible improvements

Our report includes recommendations for improving how the Social Security Administration responds to applications for disability benefits.

In our view, the agency should employ enough people to handle all applications and appeals in a timely and accurate manner while protecting the data privacy and accessibility for all applicants – including those from immigrant families.

We also believe that the agency’s leaders would be wise to listen seriously to feedback from professional benefits representatives who help people with disabilities apply for SSI and SSDI benefits, such as those we interviewed, and their clients.

The Conversation

Katie Savin is the Ford Fellow in Disability Policy Research at the National Academy of Social Insurance and a Benefits Futures Innovator at the Benefits Futures Studio, a project from the Aspen Institute Financial Security Program and the National Academy of Social Insurance. They have received prior funding from the Retirement and Disability Research Consortium, funded by the Social Security Administration.

Callie Freitag receives funding from the Disability Economic Policy Consortium via The Roosevelt Institute and the National Academy of Social Insurance.

Matthew Borus previously received funding from the Social Security Administration through the Analyzing Relationships between Disability, Rehabilitation, and Work (ARDRAW) small grant program.

​Politics + Society – The Conversation

Categories
Uncategorized

Maps are powerful political tools shaping a nation’s past, present and future – counter maps allow everyday people to reclaim the narrative

Turtle Island is what some Indigenous peoples call North America. This counter map is oriented to the east, the direction of the rising sun. The Decolonial Atlas, CC BY-NC-ND

Throughout time, maps have been useful tools for those in power to stake their claim over territories and markets. Politicians start nationwide redistricting battles to ensure partisan control, weakening the power of voters. The Trump administration’s geopolitical posturing over Greenland builds on a long history of imperialism aided by maps. And in ancient Rome, the Peutinger map depicted vast ideas of empire by placing Rome at the center of the world.

But maps can also tell hidden stories about politics and power that help people reclaim access to their own spaces and futures. These include counter maps – that is, maps that rework existing assumptions – to expand on the dominant narratives about a place to include viewpoints that were previously excluded.

As an urban and architectural designer, mapper and spatial politics researcher, I’ve seen how maps shape urban spaces and the stories told about them. I’ve also seen how maps have the power to question these stories, opening up other meanings a place can have that are shared by everyday residents and workers.

More than just digital wayfinding aids, maps are strategic tools of world-building. Maps show how certain ideas and boundaries that people may think are fixed can be rendered flexible. Anyone can make a map, and because maps are instruments of spatial storytelling, the possibilities they reveal about places are actually endless.

Who makes the maps?

Geographer Mark Monmonier famously described how to lie with maps. He pointed out that mapmakers who have power, like governments and companies, use selective editing to advance specific goals or disseminate a brand.

The Shell Oil road maps of the 1950s are a useful example of maps as marketing. With a large logo on the front and the Shell north star compass on the inside, these maps were provided free in gas stations across the country. They advertised the brand while facilitating auto travel by delineating roads and major features, including mileage charts on the backs so motorists could plan gas stops. The maps omitted competing transit systems like bus routes.

Vintage map with San Diego street names listed and marked, the Shell Oil logo placed in the center of a compass
This 1956 Shell Oil road map of San Diego notably excludes public transit lines.
Shell Oil Company/David Rumsey Map Collection, David Rumsey Map Center, Stanford Libraries, CC BY-NC-SA

Public agencies and public-private partnerships also advance agendas via maps. The Home Ownership Loan Corporation redlined maps of the 1930s show even more directly how the government and real estate industry used maps to exclude certain communities. These maps were made for almost every major American city, and the zones they marked as risky for lenders coincided with neighborhoods where African Americans lived, thus taking them out of the home ownership market.

One can look today to gerrymandering efforts in states like Texas and Florida to see how maps are used to control who has access to the levers of democracy. These redistricting cases were done outside of a typical census year in order to win more congressional seats in the 2026 elections.

Remapping the ‘behind the scenes’

If maps are used to systematically shut minority neighborhoods out of property markets, then remapping these systems can reveal how the strings of government and private industry are pulled to exclude these neighborhoods, and whom this exclusion benefits.

In my book “Radical Atlas of Ferguson, USA,” I remap this American city to show what happens behind the scenes in regional and municipal planning, revealing why such stark conditions of inequality persist there.

The suburb of Ferguson, in North St. Louis County, Missouri, made it into the national spotlight in 2014 after a white police officer shot and killed Michael Brown Jr., an unarmed Black teenager. The community response to this injustice helped to spur the Black Lives Matter movement.

With the maps in this book, I layered in new stories to unpack the strained political and economic context underlying Ferguson. For example, historian Walter Johnson points out that there are several major Fortune 500 companies located just blocks from where Brown was killed. While those companies receive heavy tax subsidies and public development incentives for their physical growth, the rest of the municipality’s spending for necessities like public schools and sidewalks remains underfunded. By highlighting these facets of the landscape, maps can show who actually controls the imaginations of urban planners and politicians.

Map of Missouri with Ferguson highlighted, showing property crime grades
While financial institutions also commit property crimes (red hashmarks) through subprime mortgages, these are rarely included in property crime maps that typically only highlight property and vehicle theft, burglary and arson.
Patty Heyda/Radical Atlas of Ferguson, USA via Belt Publishing

Remapping helps policymakers become more aware of biases within the data they use for mainstream neighborhood assessments and municipal map-making. Maps showing seemingly objective crime data, for example, often reinforce ideas of risk in minority neighborhoods. But when property crime in North St. Louis County, where a majority of Black residents live, is overlaid with the white-collar mortgage fraud crimes of 2008 – a dataset not readily available in typical municipal catalogs – it becomes evident how this area was targeted by subprime mortgage lenders. Broadening how people evaluate data and its sources can shift attention to the underlying forces shaping the statistics.

Remapping can also combine layers of seemingly unrelated information to discover new links between spatial details. For example, why is voter turnout so low in the ward where Brown was killed? A map of racial demographics combined with polling locations reveals there is not only no polling place in the majority African American ward, but also physical barriers – including an elevated rail line and stream corridor – that prevent residents from easily accessing City Hall and other polling places.

Map of Ferguson showing voting locations, public transit lines and majority Black communities by ward.
Maps reveal the physical barriers behind low voter turnout in Ferguson, Mo., including a lack of polling places and no public transit to City Hall.
Patty Heyda/Radical Atlas of Ferguson, USA via Belt Publishing

Maps for the people

As those in power continue to politicize maps, the practice of remapping can serve the broader public by making those systems of power more visible to everyone.

Counter maps have inspired activists to edit previously omitted information back into mainstream accounts. Mapmaker Andrew Middleton introduced me to one example: a petrofuturist view of the Shell Oil maps. These counter maps show the roads documented in the Shell Oil maps underwater based on projected sea level rise due to climate change – which is caused predominantly by the burning of fossil fuels produced by companies including Shell.

Maps are scaled geographical projections, ensuring legibility and usefulness. They are understood by people of all ages. They communicate graphically across languages, and they’re portable. When maps and counter maps uncover and layer the otherwise unseen relationships that shape a place, they assert new forms of collective memory, offering more meaningful versions of public authority.

The Conversation

Patty Heyda does not work for, consult, own shares in or receive funding from any company or organization that would benefit from this article, and has disclosed no relevant affiliations beyond their academic appointment.

​Politics + Society – The Conversation